
Views: 616
以 $y=x^2$ 和 $y=x^3$ 在 $[0,1]$ 之间的区域为例, 通过不同的切割方法绘制. 如直接绘图会出现多余的直线, 所以需要微调一下.
比如直接使用一下代码, 生成的 pdf 中能发现多余的直线.
\documentclass{article}

\usepackage{tikz}

\begin{document}

\begin{tikzpicture}[scale=5]
  \fill plot [domain=0:1] (\x,\x*\x)  plot [domain=1:0] (\x,{pow(\x, 3)});
\end{tikzpicture}

\end{document}
一下就是几种避免出现多余直线的绘制方法, 其中前三种都是通过 clip 切割而来.
\documentclass{article}
\usepackage{tikz}
\begin{document}
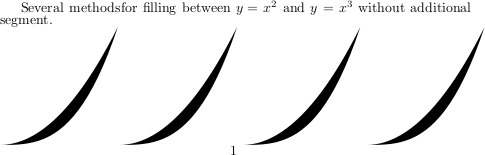
Several methods for filling between $y=x^2$ and $y=x^3$ without additional segment.
\noindent
\begin{tikzpicture}[scale=3]
\begin{scope}
\clip plot [domain=0:1] (\x,\x*\x*\x) -| (0,0);
\fill plot [domain=0:1] (\x,\x*\x) |- (0,0);
\end{scope}
\end{tikzpicture}
\begin{tikzpicture}[scale=3]
\begin{scope}
\clip plot [domain=0:1] (\x,\x*\x) |- (0,0);
\fill plot [domain=0:1] (\x,{pow(\x, 3)}) -- (0,0);
\end{scope}
\end{tikzpicture}
\begin{tikzpicture}[scale=3]
\begin{scope}
\clip plot [domain=0:1] (\x,\x*\x) -- plot [domain=1:0] (\x,{pow(\x, 3)});
\fill (0,0) rectangle (1,1);
\end{scope}
\end{tikzpicture}
\begin{tikzpicture}[scale=3]
\fill plot [domain=0:1] (\x,\x*\x) -- plot [domain=1:0] (\x,{pow(\x, 3)});
\end{tikzpicture}
\end{document}鉴于个人水平有限, 还有尚未发掘的方案, 欢迎各位斧正!